Anyone who’s done consulting or banking knows that particular night: three statements to reconcile by 2 a.m., one assumption changed, and somewhere across twenty tabs a link has silently broken. I’ve spent 10+ years across consulting, investing and big-tech strategy — five of them at TikTok and ByteDance — and I’m now CGO at an AI-native education company. Last week, I built an 18-month operating model with sensitivity analysis, scenario switching and save-able plans — by talking to Claude Code. Not one formula written. Excel never opened.
Result first, process after. This is the finished thing (demo version: the company “Beacon Academy” and every number are fictional; the method is real):

00First, one word explained: what is an Artifact?
The model lives in something called an Artifact — Claude’s term for a standalone piece of work generated inside a conversation. The mechanics: while you chat, Claude can produce code, documents, or a fully interactive web page as an independent object — it gets its own link, runs in any browser, and can be sent to anyone. No deployment knowledge needed on your side; nothing to install on theirs. The analogy: AI used to hand you a paragraph; an Artifact hands you a finished product. A consultant’s deliverable stops being a memo and becomes a living model where the partner can drag assumptions on their phone. My operating model is exactly that: by the time the conversation ended, it already existed as a link.
01Cold water first: the model took ten minutes — the homework took days
Let me say the most important thing up front: generating the model is the fastest step of the whole exercise. If you expect one prompt — “build me a financial model” — to produce something usable, you’ll get a beautifully formatted shell. Made-up inputs produce made-up outputs. Garbage in, garbage out — AI hasn’t moved that law an inch.
What actually took time were three things I fed the model before it existed — the same three rounds where Claude Code and I went back and forth hardest.
“Business research takes real time. Skip it, and every input is fiction.”— the first rule I gave Claude in that conversation
Round one: research before modeling. For every assumption that enters the model — acquisition cost, conversion rate, repurchase interval, content output rate — I required an answer to “what is this number based on?” Anything without a source gets flagged, literally: a yellow “needs research” tag right in the interface. An honest model advertises its own weak spots instead of hiding them behind four decimal places.
Round two: sources must come from the closest comparable business model. This is muscle memory from consulting: benchmarking isn’t about finding the same industry, it’s about finding the same business model. If you sell AI courses on a “single course → annual membership” structure, your pricing benchmark is not the online-education average — it’s the handful of companies with that exact structure. And you must decide which few variables actually drive the P&L. We converged on a short list — blended CAC across channels, course-to-membership conversion, unit cost of AI serving, content production rate. Everything else is noise. The model has a dedicated “Assumptions & Sources” tab where every number carries its source and logic — the stuff that dies unread in Excel cell comments.
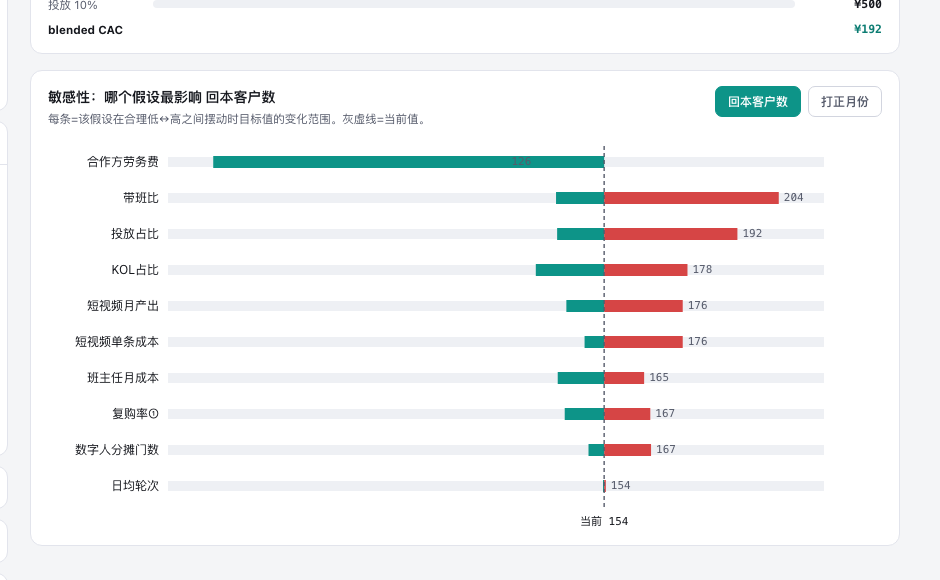
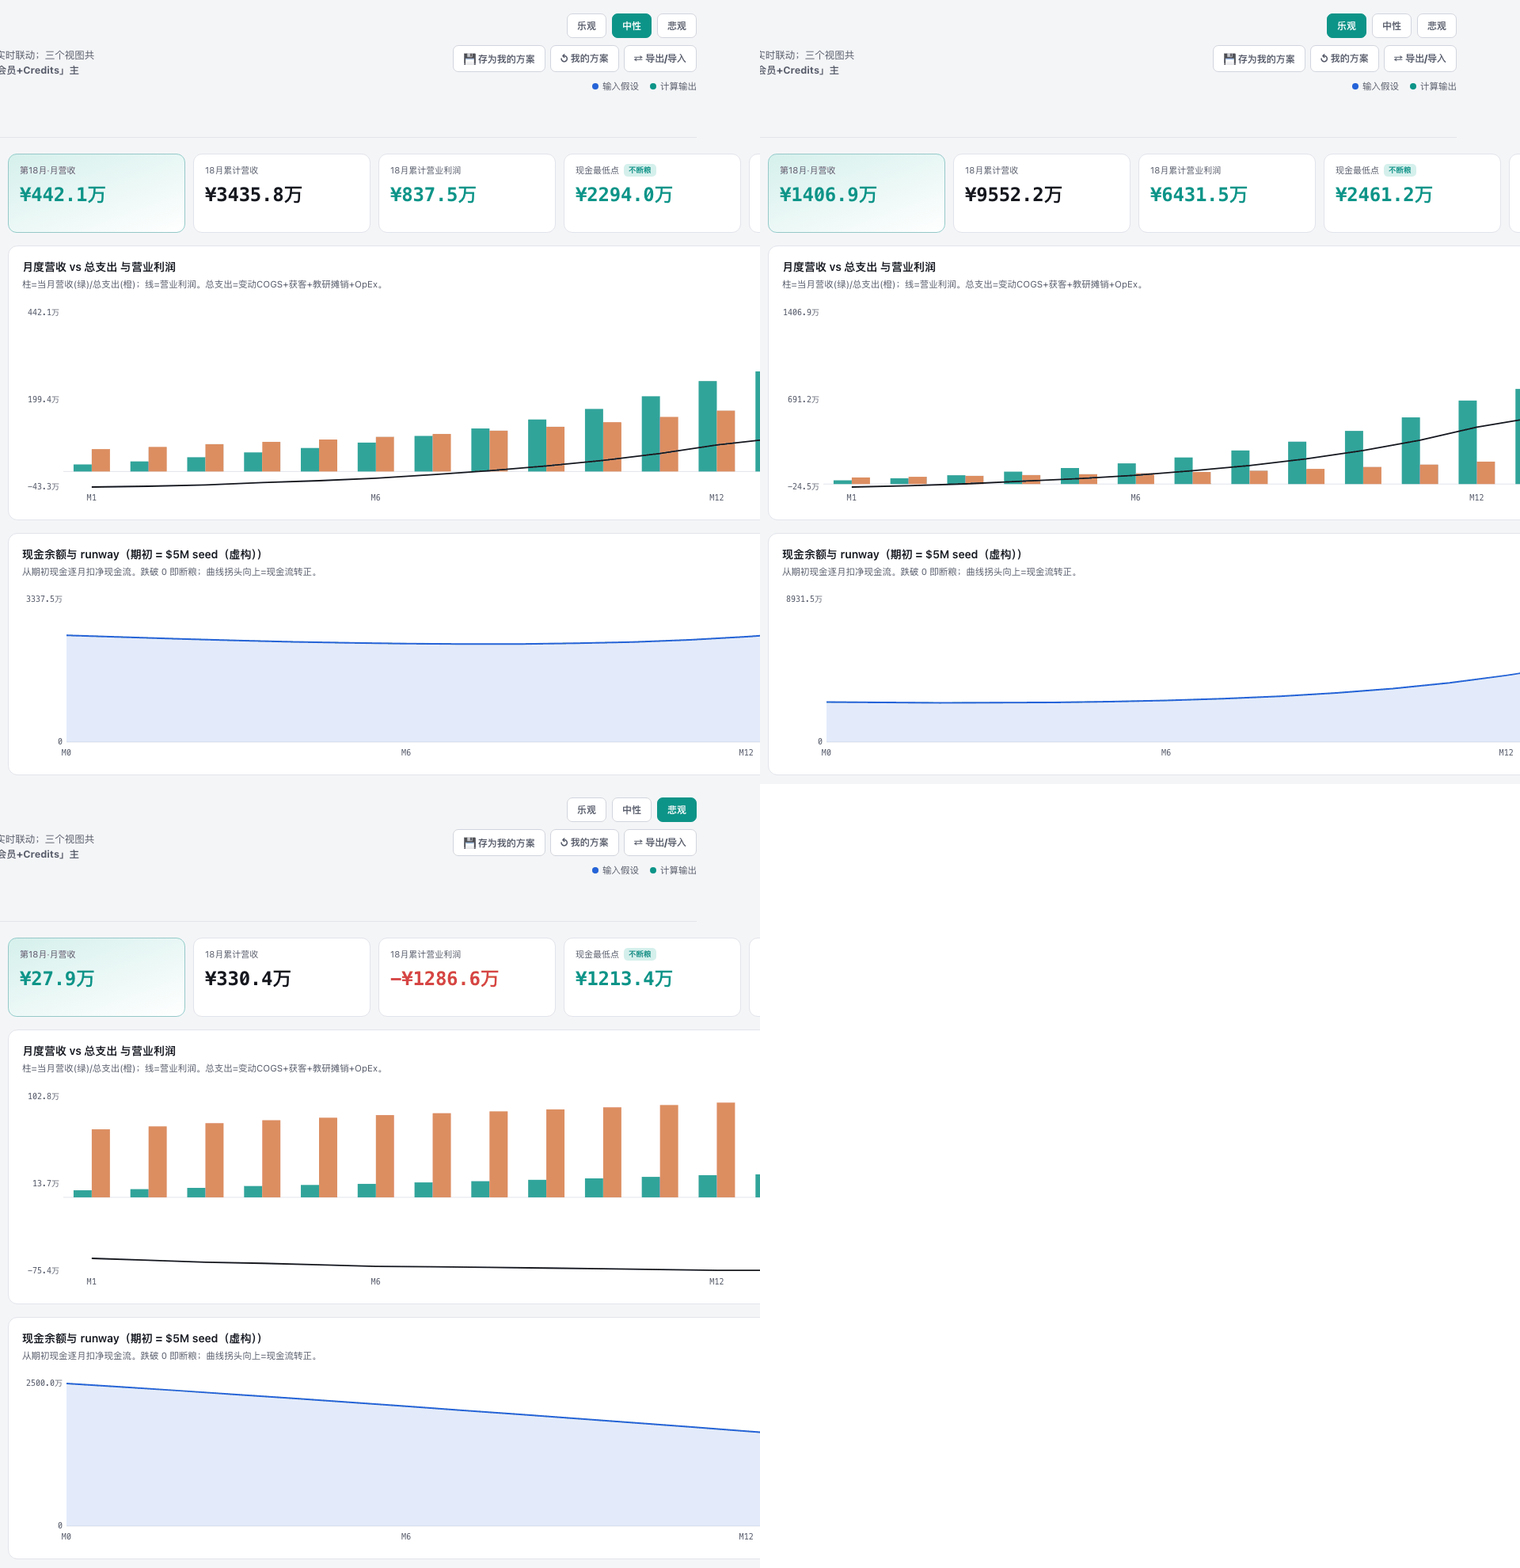
Round three: test, publish, then interrogate the model. Shipping isn’t the finish line; it’s where the interrogation starts. I had it build in the two things that cost the most manual labor in Excel: sensitivity analysis (a tornado chart — swing each assumption across its plausible range and rank what moves “customers to break even” most) and scenario construction (optimistic / base / pessimistic, entire assumption sets switching together).
02One real bug, and what it taught me
It wasn’t all smooth. Version one had a maddening flaw: I’d tune a set of assumptions, flip to another scenario, flip back — and my work was gone. The model had no memory of my plan.
I complained to Claude Code in exactly those words. It added a “Save my plan” button — snapshot all current assumptions, recall any time, export and import included. The feature was live about ten minutes after the complaint.

That little episode is what vibe coding actually feels like: you’re not using software, you’re raising it. Missing a feature? Say so, and it grows one. In the Excel era you adapted to the tool. Now the tool adapts to you.
03So — is Excel really out?
| Dimension | Excel model | Conversation-built interactive model |
|---|---|---|
| Build | Hours to days; quality depends heavily on the modeler’s craft | A few rounds of dialogue; iterations priced in sentences |
| Sharing | Send a file; recipient needs Office and needs to decode your structure | Send a link; they drag sliders on a phone |
| Sensitivity / scenarios | Data tables, scenario manager — fiddly and fragile | Native, one click |
| Assumption provenance | Dies in cell comments | A dedicated sources tab with confidence flags |
| Still stronger | Audit trails, full three-statement reconciliation, institutional deliverables | — |
The honest answer: for internal decisions and external storytelling, Excel no longer has a case. For the three-statement pack your auditors and LPs demand — Excel keeps that territory, for now. What’s changed isn’t that modeling disappeared; it’s that the valuable part of modeling moved — from knowing how to wire formulas to knowing what questions to ask, where credible inputs live, and which driver is the jugular. Which happens to be exactly what a business education trains, and exactly what AI can’t replace.
So here’s what this note is really saying: if your background is economics, business, strategy — you don’t need to learn to code. The judgment you need, you already have. What’s left is learning to talk to AI. ❧